
by Scott Winship
Last data dump for a little while, so hope you enjoy. Actually, this one is probably the most interesting one I’ve done from my perspective. Avid readers will remember that yesterday’s post ended with the teaser argument that the netroots is more ideological than partisan. Today I’ll see whether this conclusion holds up under a closer look at the netroots’ positions. Remember, I’m using Dean supporters who were active in the primary campaign and regularly used blogs for news to proxy “the netroots”. The data is publicly available from the Pew Research Center for the People and the Press.
To quote the bard Perry Farrell, Here We Go…..
The portrait the Pew data paints of the netroots is one of strong political frustration. The Pew survey asked respondents, “How good a job is the Democratic Party doing these days in standing up for its traditional positions on such things as protecting the interests of minorities, helping the poor and needy, and representing working people?” Half of the netroots members said it was doing only a fair job, and another 28 percent said a poor job. When asked how well the Party was doing defending “progressive/liberal positions”, 41 percent said fair and 43 percent said poor. Over half said they wanted the U.S. to have a third party.
Getting at the question of pragmatism versus idealism, while 39 percent of the netroots said that the most important reason – other than the issues – for supporting Dean was that he was willing to take unpopular positions, just 7 percent cited his electability. That’s a pretty remarkable contrast. It’s true that half the netroots said that the most important reason for supporting Dean was that he would change the direction of the Democratic Party, and these respondents likely thought this was entirely consistent with Dean being electable. But given the option of picking electability explicitly, they instead chose a response that is ambiguous in that regard. The implication is that changing the direction of the Party is actually more important that short-term electability for the netroots, a conclusion that accords with the importance of taking unpopular stands among them.
Fully 70 percent of the netroots said they wanted the Party to become more liberal, while the number who wanted it to become more centrist was no different than the number wanting the Party to “die off and be replaced”. Their policy positions reinforce the view of the netroots as strongly liberal. Fully 88 percent support immigration rather than feeling threatened by it, whereas Americans and Democrats specifically are split on the question. (All the figures for Americans and Democrats are from other 2004 Pew studies that are publicly available.) Nearly all members of the netroots accept homosexuality, compared with half of Americans and 60 percent of Democrats. Nine in ten respect conscientious objection to fighting in a war. This compares with six in ten Democrats and less than half of Americans. And while minorities of Americans and Democrats said free trade agreements were bad for Americans, two-thirds of the netroots thought so.
So the netroots is strongly liberal and frustrated with the Democratic Party for not representing them. The clear interpretation to this point is that the netroots believes that they are representative of the country and so Democratic candidates and officials should be promoting their policy preferences. If they were to do so – by this logic – they would win. Instead, professional Democrats are timid and transparently calculating.
Essentially all members of the netroots agreed at least somewhat that Howard Dean was the only candidate in the primaries who spoke for them. Dean’s governorship was more moderate than the preferences of the netroots, but he emphasized progressive themes in his campaign – particularly opposition to the Iraq war – and he strongly defended these themes. Indeed, 90 percent of the netroots said he was the only primary candidate who stood up to President Bush.
On the other hand, over four in five members of the netroots thought that most Democratic leaders voted for the Iraq resolution because they were afraid to stand up to the President rather than because they supported it. If one believes that one’s views are in step with those of the public and that the leadership of one’s party is rejecting those positions on the basis of a crass – and misguided! – pragmatism, then it is no wonder that one would look to an outsider who stridently defends not only one’s positions, but one’s diagnosis of the party’s problems.
Despite the fact that he dropped out of the race early on in the primary calendar, half the netroots voted for Dean in the primary election. When those who didn’t vote but would have voted for Dean are added, the total rises to 63 percent. Among those who did vote for Dean, the most popular second choice was John Edwards (31 percent), followed by…Dennis Kucinich (21 percent). The number preferring Carol Mosley Braun was not statistically different than the number preferring John Kerry or Wes Clark. Again, the interpretation most consistent with the evidence is that pragmatism is devalued because having progressive views is a greater signal of electability to the netroots than pragmatic positioning that isn’t even consistent with public preferences.
Also supporting this conclusion is the fact that 57 percent of the netroots said Hillary Clinton should not run in 2008, 60 percent said Kerry shouldn’t, and 63 percent said Gore shouldn’t. To the netroots, these are the most prominent symbols of crass Democratic pragmatism today, though Gore’s reputation has been rehabilitated notably since late 2004. On the other hand, 82 percent said Dean should run and 68 percent said Edwards should, reflecting their perceived lack of positioning and their more vocal embrace of liberalism (as reflected, for instance, in Edwards’s populist “Two Americas” critique).
One final factoid reinforcing the interpretation I have put forth here. The most common reasons the netroots gave as to why Bush won in 2004 were that Bush scared voters on security issues and that he misrepresented Kerry’s positions. Nevertheless, 41 percent said one reason Kerry lost was because his positions were too conservative, compared with 16 percent who said it was because his positions were too liberal. For a substantial segment of the netroots, there is no tension between one’s views and those of the public, and so centrist impulses are doubly disastrous.
The Rural Voter
The new book White Rural Rage employs a deeply misleading sensationalism to gain media attention. You should read The Rural Voter by Nicholas Jacobs and Daniel Shea instead.

There is a sector of working class voters who can be persuaded to vote for Democrats in 2024 – but only if candidates understand how to win their support.

The recently published book, Rust Belt Union Blues, by Lainey Newman and Theda Skocpol represents a profoundly important contribution to the debate over Democratic strategy.
Democrats should stop calling themselves a “coalition.”
They don’t think like a coalition, they don’t act like a coalition and they sure as hell don’t try to assemble a majority like a coalition.

The American Establishment’s Betrayal of Democracy
The American Establishment’s Betrayal of Democracy The Fundamental but Generally Unacknowledged Cause of the Current Threat to America’s Democratic Institutions.
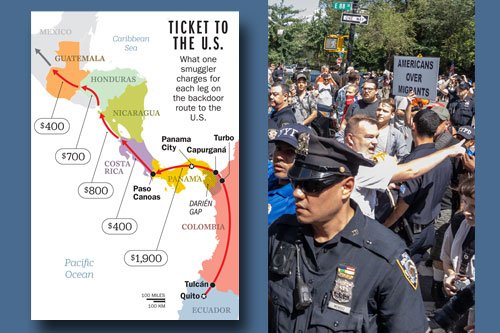
Democrats ignore the central fact about modern immigration – and it’s led them to political disaster.
Democrats ignore the central fact about modern immigration – and it’s led them to political disaster.
The Daily Strategist
July 1, 2024
Kos riffs on US News & World Report’s update on the progress of DNC Chair Howard Dean’s “50-state strategy” and the conflict with the agendas of DCCC’s Rahm Emanuel and DSCC’s Chuck Schumer. Explains Kos:
Folks at the DSCC and DCCC have to think short-term. That’s their job. That’s why we have a DNC — to work towards building a long-term, healthy, viable national party. That there’s friction is perhaps a feature, not a bug of the system…in the long-term, a healthy national Democratic Party will make the jobs of future heads of the DSCC and DCCC much easier.
In the US News article, author Dan Gilgore reports on the DNC’s promising progress in Mississippi, and gives fair vent to the DCCC’s and DSCC’s concern that ’06 campaign funding is being damaged by the DNC’s long-term focus:
Grousing about insufficient funds from the DNC, Emanuel recently told Roll Call “there is no cavalry financially for us.” Emanuel declined interview requests, but DCCC sources say more money should go to Democratic candidates in tight races, not to field organizers in long-shot red states.
The stakes are high indeed, as Gilgore notes:
A big bet. With the future of the Democratic Party at stake, Republicans are watching closely, too. “Dean could wind up looking like a genius eventually,” says a top GOP strategist. “Or this could be the election that could have been.”
…the 50-State Strategy, for the time being, is focused more on keeping or regaining control of state legislatures, which have taken on more national political value because they draw the lines for U.S. House seats. In Mississippi, Democrats control the Legislature but have lost dozens of seats recently. In Arizona, Republicans are three seats away from veto proof majorities in the state House and Senate. The state Democratic Party there has used its DNC field organizers to do aggressive outreach to American Indians and Hispanics, particularly during the huge immigrant rights protests earlier this year. “The DNC has enabled us to become part of the fabric of these communities,” says Arizona party chair David Waid. “There used to be this sense of coming around only when we wanted your vote.”
It’s a tough call, and the article has a lot more to say about the consequences and choices involved in allocating resources short-term vs. long term.
by Scott Winship
Today you are rewarded for waiting all weekend to finally – FINALLY – discover the empirical truth about the netroots. You’ve marked it in your Franklin-Covey day planner, you’ve canceled your morning appointments. Some of you probably woke up hours ago to make sure you got this as soon as possible. One or two of you may be on the verge of a breakdown from the anticipation. And tomorrow, more than a few of you will be hung-over from celebrating the arrival of another…Data Day!!
I realize that in truth, this is only going to marginally help the fact that it’s Monday, but I’m here to do my little part. In my seemingly never-ending quest to produce an accurate picture of the netroots (see here and here), I believe I am nearing the end of the journey.
Last year, the Pew Research Center for the People and the Press published a nifty report on Howard Dean’s supporters called, “The Dean Activists: Their Profile and Prospects”. You can view the report here, and you can even download the raw data used to produce it, which I’ve done for this post. The fragrant folks at Pew obtained the Democracy for America database from the Dean folks and drew a random sample from this list of contributors, MeetUppers, and volunteers. The sample is big enough that it’s a lot more useful for our purposes than the Pew survey I messed around with last week. So without further ado, let’s see what we can learn.
First, uh, some further ado. While the survey is large enough that we can make meaningful statements about the characteristics of the “Dean netroots”, the response rate in this survey leaves much to be desired. For the questions I am looking at, just 13 percent of those contacted completed the initial survey. While this is nearly twice the response rate of the BlogPac survey I refused to take seriously last week, it is still awfully low. Without any additional information about who participated and who didn’t, we would have every reason to believe that the two groups might differ in important ways that prevent us from generalizing to all members of the Dean netroots.
But to its credit, Pew took advantage of additional information provided by Democracy for America to consider whether its sample was systematically biased. It turns out that survey participants were more engaged in the Dean campaign than nonparticipants (in terms of contributions, participation in MeetUps and the like) and were particularly more likely to have made campaign contributions. When Pew categorized survey participants by campaign engagement, they found that engagement wasn’t related to political views or to most demographic characteristics. The exceptions were that highly engaged people had higher incomes and more education, were older and more politically experienced, and were more likely to support Dean’s opting out of public financing. Taken together, this evidence implies that the Pew sample is a little older and advantaged than it ought to be and more politically savvy.
To keep consistent with last week’s analyses, I define the “Dean netroots” as those who were liberal or Democrats, who “regularly” relied on blogs for news, and who participated in at least one campaign activity. The difference this time is that they also had to be in the Democracy for America database as of late 2004. My results indicate that 16 percent of “Dean activists” (those in the DFA database) met this definition for inclusion in the Dean netroots. Dean for America included over 600,000 supporters at the peak of his presidential campaign. If we assume that Democracy for America’s database included 650,000 adults in late 2004, then my estimates indicate that around 100,000 adults – or one-twentieth of one percent of them — were members of the Dean netroots in late 2004. The entire group of Dean activists comprised 0.3 percent of adults, which is close to the figure for the “Democratic netroots” from last week. I’ll discuss both groups in what follows, but I’m going to simply refer to “Dean activists” and “the netroots” to make for easier reading.
OK, let’s look at ‘em. I’m going to splice my results in with those reported in Pew’s study, which incorporates other surveys they’ve done to characterize Democrats and Americans as a whole.
While 60 percent of Democrats were women in late 2004, men were just as likely as women to be Dean activists, and they made up 60 percent of the netroots. One in four members of the netroots was under 30 years old, making the group younger than Dean activists, Democrats, and Americans taken as a whole. People under 30 made up twenty percent of each of those groups. Just 11 percent of the netroots was at least 60 years old, compared with 22 percent of Dean activists, 26 percent of Democrats, and 22 percent of Americans. So much for the claim that the elderly are overrepresented in the netroots community. Indeed, one in four members of the netroots was a student.
The netroots was also unrepresentative in terms of race. While 80 percent of Americans and 70 percent of Democrats were non-Hispanic whites in 2004, 90 percent of Dean activists and netroots members were. Blacks and Hispanics were quite underrepresented.
Among Americans as a whole and among Democrats, half of adults had no more than a high-school education in 2004. One in four was a college graduate. Contrast this with the netroots’ seventy-percent college graduation rate, which was possibly lower than the rate for Dean activists as a whole. One-fourth of the netroots had a graduate degree.
These educational differences, not surprisingly, are reflected in income differences as well. While a third of American families and forty percent of Democratic families had less than $30,000 in income in 2004, that was true of only 15 percent of Dean activists and netroots members. In contrast, 30 percent of Dean activists and 20 percent of the netroots had family incomes greater than $100,000. Just 10 percent of Democrats and Americans were that well off. The possible bias in the Dean survey can’t explain such a large disparity.
Protestants made up four in ten white Americans in 2004, split evenly between evangelicals and non-evangelicals. They accounted for three in ten white Democrats but just one in five white members of the Dean activists and the netroots. Barely any were evangelical. In fact, four in ten white members of the Dean activists and the netroots were secular – four times the incidence among white Democrats or Americans as a whole. While four in ten Americans and Democrats attended church at least weekly, just 15 percent of Dean activists and of the netroots did so. One in three Dean activists never attended church, which was also true of one in four members of the netroots but just one in ten Democrats or Americans.
And finally, as a teaser for Part Deux of this profile, a couple of findings on political characteristics. In Pew’s studies, 38 percent of Americans identified as conservative, compared with 20 percent who identified as liberals. Even among Democrats, one in four identified as conservative – nearly as many as said they were liberal (30 percent). On the other hand 80 percent of Dean activists and 90 percent of netroots members called themselves liberal.
Contrast this result with the fact that just 69 percent of Dean activists and 77 percent of the netroots identified as Democrats. The implication is that if these findings really do proxy the netroots community, then the movement is really about ideology rather than partisanship, recent claims notwithstanding.
And that’s about as tantalizing a teaser as I can come up with this early in the morning. More later this week on the political preferences and attitudes of the netroots.
Zachary A. Goldfarb has a WaPo update on the battle for the youth vote in the mid-terms and ’08, which should be of interest to Dem campaign staffers and strategists. According to Goldfarb, Dems can be cautiously optimistic about younger voters. First, with respect to turnout:
In 2004, young people voted in the highest percentage they had since 1992, and in the third-highest percentage in the nine presidential elections since a constitutional amendment in 1971 lowered the voting age to 18…in the 2004 presidential election, when the overall electorate showed a four-percentage-point increase in turnout from 2000, the turnout rate among people ages 18 to 24 increased by 11 points — to 47 percent from 36 percent. In 2005, overall voter turnout declined in the gubernatorial races in New Jersey and Virginia, except for the student-dense precincts with big voter turnout projects.
Goldfarb’s article highlights the efforts of a new organization, Youth Voter Strategies and cites an encouraging trend for Dems:
…Recently, the group has been showcasing the results of a poll on young voters done with prominent pollsters Ed Goeas, a Republican, and Celinda Lake, a Democrat. The poll found that young people believe Democrats are better equipped to handle their top concerns — gas prices, education and the economy — by a wide margin.
Democrats are emphasizing college affordability as a hot button issue with young voters, according to Goldfarb. He also offers an interesting clue for longer-range Democratic strategy from pollster Lake.
Lake said she has told Democrats they have “a major opportunity” to nurture the future of the party. “The long-term studies show that if you capture a cohort in their youth three times in a row, then you hold their party identification for the rest of their life,” she said.
But, as Goldfarb’s article points out, it’s not all about text messaging, cell phone and internet chatter, and stresses the importance of “peer-to-peer efforts in the offline world” and good, old-fashioned Election Day reminders.
by Scott Winship
I had hoped to end the week with my fifth Data Day post in a row, but I discovered late last night that I can actually analyze the raw data from the survey of Dean activists that I mentioned Wednesday. I think it will be worth it for me to play around with that over the weekend rather than just summarize the original study today. Somehow, you’ll just have to make it through the weekend….
In other news, Strategist editor Stan Greenberg has released a Democracy Corps memo [pdf] with James Carville assessing Democrats’ position in the upcoming elections. By the way, you can get on their website and subscribe to their email list to stay up to date on their work.
Greenberg and Carville note that President Bush’s approval ratings have inched up a bit, but the number of strong supporters or opponents hasn’t changed in the past month. Democrats have a fragile lead in the overall congressional vote. Majorities of voters will either vote Democratic or are basically looking for a reason not to vote Republican. One in five 2004 Bush voters say they will vote for the Democratic congressional candidate.
Dissatisfaction with Bush is rooted in his perceived indifference to the economic squeeze on the middle class, his siding with business over everyday people, his mishandling of the deficit, his lack of a strategy in Iraq, the corruption and catering to special interests within the Administration, and his failure to put the concerns and security of Americans first.
Greenberg and Carville outline a strategy for Democrats to capitalize on the voters’ desire for change, but to find out about that, you’ll have to check out the paper yourself….
And finally, for those who have only recently discovered us – and those who want to rapturously re-read every post we’ve done – I want to point out the new Archive links to the left on the main Daily Strategist page. We’ve been going for about a month now – do let us know how we’re doing! Have a great weekend.
by Scott Winship
At some point, I am going to rue the day that we decided to call this blog “The Daily Strategist.” Maybe we should have gone with “The Occasional Strategist” or “The Sometime Strategist”. Perhaps “I’ve Got Your $*^#@ Strategy Right Here!”
Oh dear, pardon my French. Anywho, I promised I would return to my post from Monday examining the number of liberals and conservatives. This is going to be a longer and very Mystery Pollster kind of post today. But even if you don’t want the arcane stuff, there are some interesting findings here on public opinion in a number of areas.
The biggest question I received from folks was how I defined the four issue areas I created: security and foreign policy; values; economic and social policy; and fiscal policy. You may recall that I defined people as liberal or conservative on a number of individual items from the 2004 National Election Study, gave weights to the items depending on how well they predicted the presidential vote, and then defined people as liberal or conservative depending on whether their (weighted) liberal responses outnumbered their (weighted) conservative responses.
Here is a summary of the issue area components, with weights included and a breakdown of how many people answered one way or another on the individual items:
Security and foreign policy:
1. human rights (weight=1.4)
• liberal = promoting human rights is a very important foreign policy goal (43%)
• conservative = somewhat important or not important at all (57%)
2. support for the United Nations (weight=1.7)
• liberal = strengthening the U.N. is a very important foreign policy goal (48%)
• conservative = somewhat important or not important at all (52%)
3. democracy promotion (weight=1.3)
• liberal = promoting democracy is somewhat important or not important at all as a
foreign policy goal (78%)
• conservative = very important (22%)
4. neoliberalism (weight=1.4)
• liberal = promoting market economies is somewhat important or not important at all
as a foreign policy goal (76%)
• conservative = very important (24%)
5. soft vs. hard power (weight=4.2)
• liberal = prefer diplomacy and international pressure to threatening the use of force
(i.e., placed self as being between 1 and 3 on a 7-point scale) (39%)
• conservative = prefer threatening the use of force (i.e., placed self as being
between 5 and 7) (39%)
6. military strength (weight=1.6)
• liberal = very or somewhat important for the US to have a strong military, or not
important at all (43%)
• conservative = extremely important (57%)
7. war on terror (weight=6.3, decreased from 23.7)
• liberal = disapprove of Bush’s handling of the war on terror (44%)
• conservative = approve (56%)
OK, let’s pause for some comments here. First let me say something about the weights. These were produced using what’s known as logistic regression. Essentially I predicted whether a person voted for Bush or for Kerry using these seven items. The weights are “odds ratios”. So the weight of 4.2 for “soft vs. hard power” indicates that the odds of voting for Bush rather than Kerry were 4.2 times higher if a person leaned toward military force than if she leaned toward diplomacy, controlling for the effect of the other six items. Intuitively, I’m giving items greater weight the more important they are in predicting how people voted.
I arbitrarily lowered the weight on the war on terror item to be 1.5 times the next-highest weight because otherwise this single question completely determined whether one was coded as a liberal or conservative on security and foreign policy. That’s worthy of reflection – the “effect” of a person’s response to this item on her vote is in some sense over five times the effect of the next-most important item.
The war on terror item itself isn’t ideal – it reflects both attitudes toward Bush’s policies and attitudes toward his competence. But this is the best I could do given the questions available, though I am exploring other approaches. As for other items, it is perhaps problematic to define the liberal and conservative positions on democracy promotion, but since the weight on this item is so small, it doesn’t really have any effect on the results.
Finally, note that some people are neither coded as liberal nor conservative on the hard vs. soft power item. That’s because they could give a neutral response (4 on a scale from 1 to 7). When a person didn’t have liberal/conservative scores on every item in an issue area, I compared weighted liberal and conservative responses for the items she did have a score on. I required that the person have scores on a majority of the items, otherwise she received no overall liberal/conservative designation for that issue area.
Next: values:
1. Constancy of moral values (weight=2.8)
• liberal = we “should adjust our moral views to a changing world” (agree strongly or
somewhat) (47%)
• conservative = should not (disagree strongly or somewhat) (43%)
2. Feminists vs. fundamentalists (weight=1.6)
• liberal = feel more warmth (on a scale of 0-100) toward feminists than toward
Christian fundamentalists (35%)
• conservative = feel more warmth toward fundamentalists (41%)
3. Legality of abortion (weight=1.6)
• liberal = “a woman should always be able to get an abortion as a matter of personal
choice” (36%)
• conservative = a woman should only be able to get an abortion in the case of rape,
incest, or danger to her life (if at all) (46%)
4. Public funding for abortion (weight=1.8)
• liberal = favor a state law providing public funds for poor women to have abortions
(38%)
• conservative = oppose (62%)
5. Gay marriage (weight=2.4)
• liberal = “same-sex couples should be allowed to marry” (or get civil unions if this
option was volunteered by the respondent) (36%)
• conservative = “should not be allowed to marry” (61%)
6. Job protection for gays (weight=1.0, increased from 0.9)
• liberal = favor “laws to protect homosexuals from job discrimination” (74%)
• conservative = oppose (26%)
7. Patriotism (weight=1.5)
• liberal = love for country is very, somewhat, or not very strong (45%)
• conservative = extremely strong (55%)
8. Capital Punishment (weight=5.2)
• liberal = oppose the death penalty (29%)
• conservative = favor (71%)
9. Gun control (weight=2.1)
• liberal = “the federal government should make it more difficult to buy a gun” (55%)
• conservative = should not (45%)
Note that one can be neither liberal nor conservative on the abortion item if she believes that abortion should be allowed in cases other than rape, incest, or danger to the mother’s life, but only once the need for an abortion has been established. I increased the weight on the gay job discrimination item because I didn’t want any of the weights to be less than one.
Economic and social policy:
1. Government activism vs. individualism (weight=3.1)
• liberal = the federal government “should see to it that everyone has a job and a
good standard of living” (34%)
• conservative = it “should just let each person get ahead on their own” (47%)
2. Jobs vs. environment (weight=1.9)
• liberal = we “should protect the environment even if it costs some jobs or reduces
living standards” (scored self as 1-3 on a 7-point scale) (45%)
• conservative = “protecting the environment is not as important as maintaining jobs
and living standards” (scored self as 5-7) (27%)
3. Illegal immigration (weight=1.6)
• liberal = “controlling and reducing illegal immigration” is only somewhat important
or not at all important as a foreign policy goal (42%)
• conservative = very important (58%)
4. Unions vs. corporations (weight=5.5)
• liberal = feelings toward labor unions are warmer than feelings toward big business
(on a scale from 0 to 100) (44%)
• conservative = feelings toward big business are warmer (36%)
5. Poor people vs. business people (weight=1.5)
• liberal = feelings toward poor people are warmer than feelings toward business
people (41%)
• conservative = feelings toward business people are warmer (26%)
6. Opportunity (weight=6.0)
• liberal = agree that “one of the big problems in this country is that we don’t give
everyone an equal chance” (strongly or somewhat agree) (49%)
• conservative = disagree (strongly or somewhat) (34%)
7. Civil rights enforcement in employment (weight=2.8)
• liberal = the federal government “should see to it that black people get fair
treatment in jobs” (54%)
• conservative = it “is not the federal government’s business” (43%)
8. Outsourcing (weight=1.3)
• liberal = the federal government should discourage U.S. companies from “hiring
workers in foreign countries to replace U.S. workers” (66%)
• conservative = it should encourage them or do nothing (34%)
9. Health care system (weight=1.4)
• liberal = a government insurance plan should “cover all medical and hospital
expenses” (placed self as 1-3 on a 7-point scale) (47%)
• conservative = all such expenses should be “paid by individuals through private
insurance plans” (5-7 on a 7-point scale) (34%)
10. Social security privatization (weight=3.1)
• liberal = oppose allowing people to “put some of their Social Security payroll taxes
into personal retirement accounts” (25%)
• conservative = favor (43%)
11. School vouchers (weight=1.9)
• liberal = oppose having the government “give vouchers to low-income families so
their kids may attend private or religious school instead of local public
school” (67%)
• conservative = favor (31%)
Note that respondents can be neither liberal nor conservative on most of these items.
Finally, fiscal policy:
1. Expansion of government (weight=1.7)
• liberal = “government has become bigger because the problems we face have
become bigger” (59%)
• conservative = government has become bigger “because it has gotten involved in
 things that people should do for themselves” (41%)
2. Current role of government (weight=1.5)
• liberal = “there are more things that government should be doing” (58%)
• conservative = “the less government the better” (42%)
3. Taxes vs. spending vs. deficit reduction (weight=1.5)
• liberal = against cutting domestic spending, against tax cuts, and for increasing
domestic spending (25%)
• conservative = either a) against increasing spending and for either cutting spending
orfurther tax cuts, or b) for leaving taxes, spending, and the deficit as is (31%)
4. Spending vs. services (weight=2.5)
• liberal = want more government services even if it means more spending (39%)
• conservative = unsupportive of more government services if it means more
 spending (61%)
5. Tax progressivity (weight=3.9)
• liberal = a) agree that either one’s own taxes or those of rich are too low and
 b) disagree that the taxes of the rich are too high and that the taxes of the poor
are too low (61%)
• conservative = a) disagree that one’s own taxes and those of the rich are too low
and b) agree that the taxes of the poor are too low, agree that either one’s own
taxes or those of the rich are too high, or supported the Bush tax cuts and agree
that one’s own taxes or those of the rich are about right (29%)
6. Spending on social programs (weight=3.3)
• liberal = increase spending on public education, child care, and aid to the poor
(41%)
• conservative = decrease spending on one of the three or leave it as is on two of the
three (38%)
These items are perhaps the most arbitrary, and a couple of them leave many people with no liberal/conservative designation. Incidentally, I separated fiscal policy from economic and social policy because people may, for instance, take conservative positions on the latter but be in favor of progressive taxes or increased spending. Or they may philosophically favor liberal positions on economic and social policies but in practice be unwilling to pay for them (or may disagree about how to distribute the costs).
Once I had everyone coded on these four issue areas (with some people missing one or more codes due to nonresponse), I compared the weighted number of liberal and conservative codes for the four areas to get an overall classification as being operationally liberal or conservative. The weights were again based on logistic regression and again are odds ratios. Security and foreign policy received the highest weight – 10.1, which was actually reduced from 14.5 to equal 1.5 times the next-highest weight. That next-highest weight was for economic and social policy (6.7). Values came next (5.4) followed by fiscal policy (2.7).
And that’s all I have to say about that. Simple, huh? I am certain that this won’t be the last set of estimates I produce, so I would gladly accept feedback and suggestions for improvement. Go nuts….
USA Today may not be known for cutting-edge political reporting, but they have an article that should be clipped and posted on the bulletin boards of every Democratic campaign. The article, Martin Kasindorf’s “Immigrant Groups Aim: Turn Marchers to Voters” provides an encouraging introduction to the current and potential power of immigrant voters.
Kasindorf notes that applications for citizenship have increased by 20 percent over last year, an indication of “immigrants’ growing determination to counter anti-immigrant legislation and rhetoric.” He cites statistics from the “We Are America Alliance” voting and citizenship campaign “Democracy Summer”:
The alliance estimates that the nation’s immigrant population represents an untapped resource of 12.4 million potential new voters. According to a report prepared from U.S. government statistics and released last month by the alliance, they include: 9.4 million foreign-born residents eligible to become citizens; 1.9 million children of immigrants, ages 18-24, who have not yet registered to vote, and another 1.1 million children of immigrants who will become old enough to vote by the 2008 presidential election.
The lesson of 1994, when California’s Republican Governor Pete Wilson pushed Proposition 187, denying state benefits to immigrants, may be repeated, suggests Kasindorf:
In reaction to Proposition 187, California State Assembly Speaker Fabian Núñez says, naturalizations of Mexican-born California residents surged more than tenfold from 14,824 in 1994 to 151,959 in 1996. Nationally, “the big Prop 187 surge” resulted in 1.1 million more Hispanic registered voters in 1996 than in 1994, says Antonio Gonzalez of the Southwest Voter Registration Education Project.
Faced with the loss of Social Security, Medicare and fear of deportation, many became citizens and an estimated 90 percent of the new Latino voters cast ballots for Democrats, according to Sergio Bendixen, a Miami-based pollster. Further, Kasindorf, says:
Núñez credits that upheaval for elevating him and other Hispanic Democrats, including Los Angeles Mayor Antonio Villaraigosa. “Now we can take this California experiment and move it across the country,” Núñez says. Cecilia Muñoz, vice president of the National Council of La Raza, says: “The potential for impact is greater now because Latinos are now a bigger presence across the country.
The author points out that only 47 percent of voting-eligible Latinos cast ballots in 2004, compared to 67 percent of eligible white voters and 60 percent of eligible African Americans. The Alliance is seeking to raise $20 million to increase immigrant voter turnout by one million. Eliseo Medina, vice president of the Service Employees International Union who is working with the Alliance says that the greater impact will be felt in 2008, but notes that there are currently “10 or 15 districts” where more Latino voters could “make a difference.” Kasindorf Spotlights races in four of those districts in one of several informative sidebars accompanying the article.
Jonathan Alter’s MSNBC/Newsweek column “How to Beat Cut and Run,” provides some penetrating insights into Karl Rove’s battle plan:
For more than a quarter century, Karl Rove has employed a simple, brilliant, counterintuitive campaign tactic: instead of attacking his opponents at their weakest point, the conventional approach, he attacks their strength. He neutralizes that strength to the point that it begins to look like weakness. When John McCain was winning in 2000 because of his character, Rove attacked his character. When John Kerry was nominated in 2004 because of his Vietnam combat experience, the Republicans Swift-Boated him. This year’s midterm elections will turn on whether Rove can somehow transform the Democrats’ greatest political asset—the Iraq fiasco—into a liability.
Sounds about right. Rove is clearly a master at exploiting timidity in political adversaries. Alter explains further:
After escaping indictment, Rove is focused again on what he does best: ginning up the slime machine. Anyone who dares criticize President Bush’s Iraq policy is a “cut-and-run” Democrat….The object is instead to either get the Democrats tangled up in Kerryesque complexities on Iraq—or intimidate them into changing the subject to other, less-potent issues for fear of looking like unpatriotic pansies…Rove’s notion is that strong and wrong beats meek and weak.
Alter’s take on the Dems’ best ’06 campaign message may be a little simplistic for some:
Unless things improve dramatically on the ground in Iraq, Democrats have a powerful argument: If you believe the Iraq war is a success, vote Republican. If you believe it is a failure, vote Democratic.
It’s a message that will have more resonance in Senate races, where foreign policy issues always hover at center stage. House candidates will have to address in considerably more detail issues like health care, education and other leading concerns of voters in their districts. But all issues are affected by the squandering of billions of dollars on the unpopular war in Iraq, and Alter is surely right that the worst mistake Dems can make is to try and hide from the issue.
by Scott Winship
Today I come to you from the eastbound orange Metro line. I promise to get back tomorrow to my earlier post examining the prevalence of liberals and conservatives, as many of you shouted from the rooftops, “Arcane methodological details, dammit!! We want more arcane methodological details!!” While I hope this blog’s primary contribution ultimately won’t be to unite the bickering community of progressive public-transit-riding data geeks, I’ll happily satisfy the public.
As you hopefully recall, yesterday I found that the Democratic netroots community was indeed large enough to impact the electorate in terms of raw numbers. I estimated it at 1.6 million adults – bigger than the civil liberties and gay activist communities, as big as the feminist and minority activist communities, smaller than the group of environmental activists, and much smaller than the labor movement. I want to qualify these conclusions today and to consider what we know about the make-up of the netroots.
First, a sheepish admission – I should have noted the uncertainty in my estimate. “Sampling error” is Statistics 101. Drawing another random sample would very likely produce some estimate other than 1.6 million adults, just because different people would be randomly picked. I should have qualified my estimate by noting that there is a 16 percent chance that the true number of Democratic netroots activists – by my definition – is less than 950,000 and a 16 percent chance that it is more than 2.2 million adults. There is a 2.5 percent chance that the figure is less than 350,000 and a 2.5 percent chance it is more than 2.8 million. My estimates are just that, but we can be reasonably confident that the conclusions I stated about the netroots’ size relative to interest groups’ are accurate. Mea culpa – but note that I’m pointing out the oversight without anyone mentioning it to me first! I’d make a terrible politician.
Upon further reflection, however, I think my definition of the netroots actually overstates its size. By my definition – a liberal or Democrat who was minimally politically active and regularly gets news from blogs – I myself would be part of the netroots, though I rarely read the more stridently loud-and-proud blogs. And if one compares the 1.6 million figure I came up with yesterday to a more reliable estimate of the DailyKos audience by a leading company that tracks internet traffic – 212,000 unique visitors in April 2005 – the possibility that there are lots of people like me included in my definition becomes very real. The same company, comScore, found that while 34,000 people visited DailyKos.com the day before the November 2004 election, just 86,000 visited it on Election Day.
Being in academia right now, I will use this opportunity to bust out the most clichéd conclusion found in that rarefied world: Further research is needed.
Regardless of the size of the netroots community, if it is no different than the rest of the Party, then it wouldn’t really be influential in the sense of affecting Party positions, whether you think that would be a good thing (netroots community) or a bad thing (Chait et al.). So how does it look?
Well, the short answer is that we don’t know. Seriously. The Pew study I relied on yesterday is too small to be used for making meaningful statements about the netroots, even as I defined it. (That ol’ sampling error problem is a big problem when you start slicing and dicing the community.) There was a poll done last month by Chris Bowers of MyDD under the auspices of BlogPac. Bowers contacted a random sample of MoveOn.org members via email. This would be quite an interesting poll, except that just 7 percent of those contacted agreed to participate. You can almost guarantee those folks are different from MoveOn.org’s membership as a whole. I’ll link here, but really, these results shouldn’t be taken seriously. I didn’t bother reading further after getting to the response rate, which Bowers is to be commended for including.
Bowers also references an earlier (voluntary) Blogads survey, but just like his own, it can’t be trusted to be representative of the netroots as a whole. Again, I couldn’t tell you what it says because it’s not worth the time it would take to read it.
Then there’s a recent analysis of the DailyKos.com readership by comScore. Their methods lead me not to put great stock in their conclusions either. While I have more trust that they can track the overall readership of a site like DailyKos accurately, the challenges to ensuring that one has a representative snapshot of a site’s viewers are quite steep. comScore solicits panelists online and through promotions, which means they get a non-random sample to begin with. So they then must weight panelists’ responses so that in the aggregate they are representative of the population of interest. But comScore is unable to fully determine what makes their sample “non-random” – it may be known to be disproportionately male, but what if it consists of people who are less social than average or who are more likely to allow comScore to install tracking software on their computer? Furthermore, to create the weights, they must have accurate information on the “universe” of internet users. But one needs another survey to get this information, and that survey may itself be flawed (which would even affect their overall estimates of readership).
Here’s some sparse information on the comScore findings. Note that according to their methods, more senior citizens read DailyKos than do people between the ages of 18 and 34. This just seems highly unlikely to me, given that aggregate blog readership and internet use are skewed toward the young. Just 34 percent of adults age 65 or older are online, compared with 89 percent of those 18 to 28 years old. My tabulation of the Pew data from yesterday indicates that just 2 percent of senior citizens regularly relies on blogs for news, compared with 39 percent of those 18 to 29 years old.
In short, don’t believe the hype – we know very little about the netroots per se. Later this week I’ll look at a more reliable study of Dean activists that may be the best source of information we have on the Democratic netroots.
by Scott Winship
Over the past few weeks, the blogosphere has been debating the influence of the netroots on the Democratic Party, mostly inspired by the Lieberman/Lamont race. (For examples, click on any word that’s in this sentence.) At issue are two questions: how influential will the netroots be in elections, and will it help or hurt Democrats at the ballot box? I was going to follow up on yesterday’s post, but I couldn’t resist the urge to examine these questions with some data. Disclaimer: I’m not taking sides here and I claim no expertise on the netroots or the ways in which it exercises influence. Should snark, disdain, profanity, or sacrilege proliferate as a consequence of this post, I claim no responsibility.
I’ve located a few surveys of the netroots that are quite interesting. But the data geek in me began drooling when I learned that the Pew Internet & American Life Project lets anyone with access to statistical software download the raw data. I – like so many other people – spent yesterday evening creating crosstabulations on my laptop as I rode the bus home from my gym.
Moving right along, how influential can we expect the netroots to be? For my part in this debate, I’m going to just look at its size as one indicator. I’ll (mostly) leave it to others to elaborate on how my findings do or do not affect the influence the netroots wields. Using a post-election survey from 2004, I defined “the Democratic netroots” as those adults who “regularly” get “news or information” from “Online columns or blogs such as Talking Points Memo, the Daily Kos, or Instapundit” and who are either self-identified Democrats or liberals. Blogs were one of twelve media sources that were asked about, and each of the twelve was a separate question (so respondents didn’t have to choose between competing sources). Rather than answering that they consulted a source “regularly”, respondents could say that they did so “sometimes” or “hardly at all”. Everybody happy?
What does your gut tell you when you think of the percentage of adults that can claim membership in the Democratic netroots? The answer, according to this survey, is 1 percent. One percent of adults translates into 2.24 million people. At first glance, one percent may sound pathetic. But let’s provide some context. Since one strand of the blogosphere debate has compared the netroots with various special interest groups, it might be instructive to consider how large those groups might be. But first we need to isolate the activist subset of the Democratic netroots so that the comparisons below are apples-to-apples. Take a look:
• Democratic netroots members who either attended a campaign rally, donated money to a campaign, knocked on doors, or worked a phone bank – 1.6 million adults (0.7 percent of adults)
• Union members – 15.7 million
• NOW – 500,000 contributing members
• NARAL Pro-Choice America – 900,000 members of their “Choice Action Network”
• Sierra Club – 750,000 members
• National Resources Defense Council – over 1 million members
• ACLU – over 500,000 members
• Human Rights Campaign – nearly 600,000 members
It’s difficult to make comparisons because these groups do not include all activists in a given issue area. Plus there’s obviously substantial overlap among the groups. But it’s safe to say that there are more Democratic netroots activists than civil liberties or gay rights activists, at least as many as there are feminist activists (and hence probably minority activists), but fewer than there are environmental activists or (especially) union members. Given the influence these groups have had on the Party, it seems reasonable to conclude that the netroots really is a force to be reckoned with. On the other hand, these interest groups draw their strength from the popularity of their mission. I would argue that the netroots’ “mission” is to elect candidates who are as uniformly liberal as public opinion in the relevant electorate allows. If I’m right, then mobilizing popular support for an across-the-board liberalism is likely to be significantly more difficult than assembling support for a liberal position on a single issue.
I’ll try to address whether I’m right or not tomorrow. But no big promises that it’ll be possible.
Latest Research from:

tds-wwc-roundtable
