
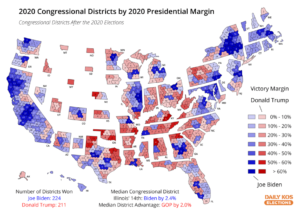
Dail Kos Elections has a fun map in their post, “Morning Digest: We’ve finished calculating the 2020 presidential results for every House district” (flagged by Ruy Teixeira). From the opening paragraphs: “Pres-by-CD: Our project to calculate the 2020 presidential results for all 435 House seats nationwide concludes, appropriately enough, with Pennsylvania, the state whose electoral votes sealed Joe Biden’s victory four days after Election Day. You can find our detailed calculations here, a large-size map of the results here, and our permanent, bookmarkable link for all districts here. You can also find a traditional geographic map version here of the cartogram at the top of this post that shows the presidential election result margin in every district nationally….With figures from the Keystone State in hand, we now know that Biden carried 224 congressional districts while Donald Trump prevailed in 211. That’s very close to the 222-213 split between House Democrats and Republicans that emerged from the November elections, which is due to the fact that both parties occupy a similar number of so-called “crossover” districts: Seven Democrats hold seats that Trump won while nine Republicans represents districts that went for Biden….The number of crossover districts—16 in total—is extremely low by historical standards but continues a downward trend reflecting our nation’s increased political polarization. Following the 2016 elections, there were 35 crossover seats, which was an increase from 2012 but a steep drop from the 83 produced by the 2008 Democratic wave. For much of the post-war era, there were 100 or more such districts, according to the Brookings Institution—to find a lower proportion in a presidential year, you have to go back to the GOP landslide of 1920, when there were just 11 crossovers.” The map:
“Heck, I don’t know which side is more likely to gain or lose seats in the Senate or House next year,” Charlie Cook writes at the Cook Political Report. “History suggests that Republicans should pick up seats, and even minimal gains would likely put them on top in either or both chambers, given the Democrats’ slim majorities. But then again, a party in turmoil—and in some cases eating its own—is not well positioned to win any elections….So, having outlined what we don’t know yet about next year’s midterms, what do we know? Incumbency is of less value than ever before, and candidates’ personal brands matter less than they used to. As longtime National Journal writer Ron Brownstein says, it’s not the name on the back of the jersey that matters so much anymore, it’s the color of the jersey. Ours is a parliamentary voting system now…n the House, only seven Democrats represent districts Trump carried, while nine Republicans hold seats that Biden carried. With the House pretty sorted out along partisan lines, it won’t take a tsunami or even a more conventional tidal wave to move a dozen or two seats. Even a ripple might do it.”
Peter Wade reports that a “Whopping 46 Percent of Republicans Would Disown GOP for the Trump Party, Poll Says” at Rolling Stone, and notes, “The Grand Old Party ain’t grand enough to keep devoted Trump fans from abandoning the party if the former president creates his own….In a new Suffolk University–USA Today poll of Trump voters released on Sunday, nearly half — 46 percent to 27 percent — say they’d ditch the GOP for another if the twice impeached Trump were at the helm….Also, over 50 percent of respondents said the GOP should be “more loyal to Trump.” And 58 percent believe the lie that the January 6th attack on the Capitol was “mostly an antifa-inspired attack that only involved a few Trump supporters….An astounding 73 percent say President Biden’s election win is not legitimate. This perhaps shouldn’t be surprising considering major news networks keep inviting prominent Republicans onto their airwaves to spread Trump’s election lies.” There’s a clue.
Ronald Brownstein shares some thoughts about “The blind spot in the immigration debate” at CNN Politics: “While the working-age population is stagnating, the senior population is exploding. Even under current levels of immigration, the Census Bureau projects that the senior population will grow by nearly 40% from now through 2035, almost exactly 10 times as fast as the working-age population….In a recent paper, Noorani and co-author Danilo Zak calculated that these trends will produce a precipitous decline in what’s called the “dependency ratio,” the number of working-age adults — defined as those aged 18-64 — available to support each senior. Today there are about 3.5 working-age adults for each senior; by 2060, that number will plummet to 2.7, the lowest in modern times. Such a decline will increase pressure either for cuts in federal retirement programs, difficult tax increases on the working-age population to fund those programs or some combination of both….The nation’s growing diversity is centered among the young: Frey says the 2020 census will find that for the first time, a majority of the nation’s under-18 population is non-White. But because the US largely cut off immigration from 1924 to 1965, most older Americans are White….I’ve described this demographic contrast as a collision between “the brown and the gray,” and one of its many implications is that through the 21st century, a growing and preponderantly White senior population will depend on an increasingly non-White working-age population to pay the taxes that fund Social Security and Medicare….”Without legal immigration, the United States is not going to see sustained population growth and we’ll see declining economic growth as a consequence,” says Cato’s Bier. “It’s just that simple.”


The only reason this is a blind spot in the immigration debate is because Democrats insist on focusing on measures that would establish de facto open borders as opposed to fixing legal migration routes.
And we are going to let Cato gloss over what happens after 2035…?
Measuring Social Security’s solvency with a time period that ends right at the average death year of the humongous baby boomer generation. No sleight of hand there! 🙄